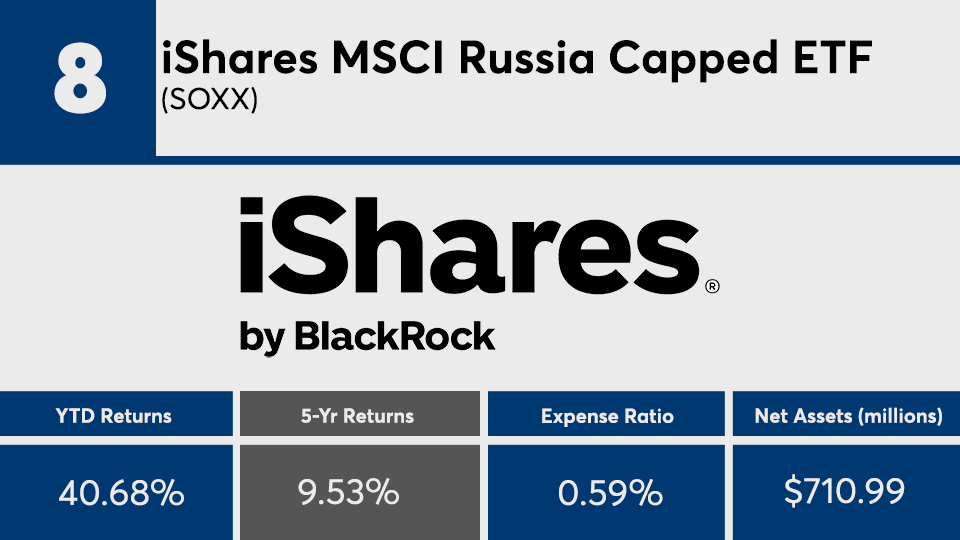
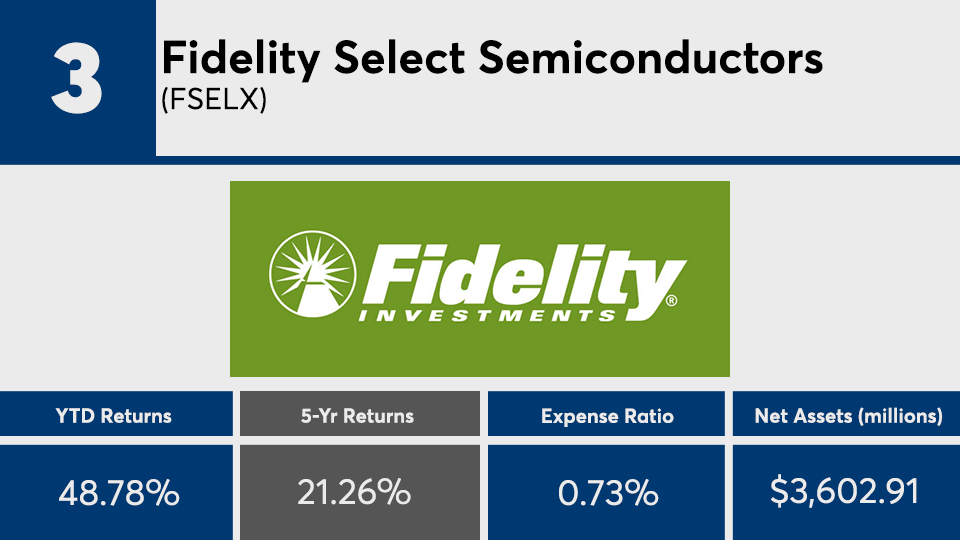
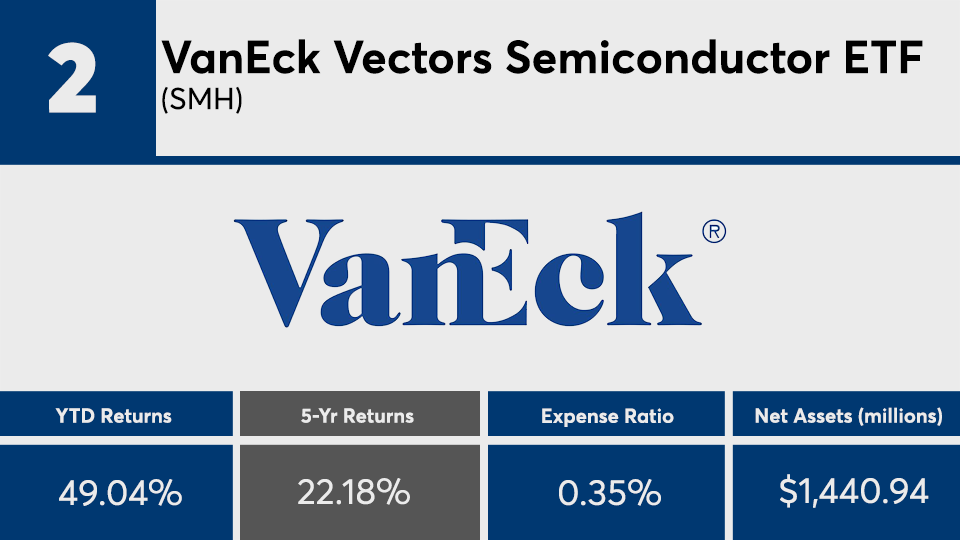
In some sectors, heavy weightings can mean huge gains.
But despite the impressive returns of the top-performing mutual funds and ETFs of the year, one expert stresses the importance of diversification in long-term investing.
The 20 funds with the largest gains of 2019 have so far posted an average return of more than 40%, according to Morningstar Direct. That’s more than 20 basis points higher than the Dow’s 19.81%, as tracked by the SPDR Dow Jones Industrial Average ETF (DIA), and nearly 15 basis points higher than the S&P 500’s 24.70%, as tracked by the SPDR S&P 500 ETF (SPY), over the same period, data show.
Greg McBride, senior financial analyst at Bankrate, notes that nearly all of the front-runners benefited from their underlying holdings in technology. “Technology stocks have been the market leader and this year’s top-performing funds are dominated by those focused on tech,” McBride says.
Fees associated with the top 20 are slightly higher than the broader fund universe. At 65 basis points, the average net expense ratio was almost 10 basis points higher than the 0.48% investors were charged on average for fund investing last year, according to Morningstar’s most recent annual fee survey, which reviewed the asset-weighted average expense ratios of all U.S. open-end mutual funds and ETFs. The industry’s largest fund, the $845 billion Vanguard Total Stock Market Fund (VTSAX), carries a 0.04% expense ratio and has returned 24.26% so far this year.
In addition to posting exceptional returns this year, the leading 20 also outperformed the broader market over the last five years, data show. With an average 5-year gain of 16.60%, these funds bested the Dow’s 12.01% gain and the S&P 500’s 15.98%, over the same period.
“Narrower investing mandates typically mean higher expense ratios, while broader mandates — and especially those that are passive rather than active — will carry lower expense ratios,” McBride says.
Although these funds might be attractive to many over both the YTD and 5-year periods, McBride reminds advisors to encourage their clients to remain well-diversified to achieve steady, long-term growth.
“The 5-year returns have been pretty strong too, but trees don’t grow to the sky. Having exposure to the entire market, rather than focusing on one or two segments, is an essential aspect of being properly diversified,” he says.
Scroll through to see the 20 top-performing mutual funds and ETFs (with at least $500 million in assets under management) ranked by year-to-date returns through Nov. 1. Funds with investment minimums over $100,000 were excluded, as were leveraged and institutional funds. Assets and expense ratios for each, as well as year-to-date returns, are also listed. The data shows each fund's primary share class. All data from Morningstar Direct.


