The 20 worst-performing mutual funds of the decade

Complimentary Access Pill
Enjoy complimentary access to top ideas and insights — selected by our editors.

Despite the ability to deliver short-term outperformance, funds with heavy concentrations in any one sector can be problematic for long-term investors. Analysis of the decade’s worst-performing mutual funds is a case in point.

Though a handful of the 20 mutual funds with the worst 10-year returns managed some impressive short-term gains, their average returns over both the near- and long-term periods have underwhelmed. With an average loss of more than 2% over the past decade, the mutual funds on this list undershot index trackers such as the SPDR S&P 500 ETF Trust (SPY) and the SPDR Dow Jones Industrial Average ETF Trust (DIA), which have posted 10-year gains of 14.90% and 13.55%, respectively, according to Morningstar Direct data.

This year, some of the mutual funds with the biggest long-term losses managed gains of more than 40%, data show. When looking at their overall average, however, they returned less than 1%, well below the broader indexes — SPY and DIA managed a YTD gains of 10.01% and 2%, over the same period. In bonds, the iShares Core U.S. Aggregate Bond ETF (AGG) has reported YTD and 10-year gains of 6.52% and 3.59%, respectively.

A similar screen of the broader mutual fund industry, meanwhile, reported YTD- and 10-year gains of 7.11% and 10%, respectively, data show.

Analysis of the mutual funds with the worst long-term gains may provide the platform advisors need to discuss portfolio diversity with clients, particularly because these funds are heavily concentrated in commodities, MLPs and precious metals, says Stephen Cavagnaro, director of private clients at Anchor Capital Advisors, a value-focused asset manager and wealth advisory firm based in Boston.

“It’s no surprise ... that the bulk of these portfolios are commodity related,” Cavagnaro says when looking at the industry’s worst performers over 10 years. “This concentration of underperforming funds is a key example of the need to diversify around specific sectors or investment trends as opposed to chasing returns.”

Similar to the top-performing mutual funds of the decade, the worst performers also carry high fees. With an average net expense ratio of 90 basis points, these funds are twice the cost of the 0.45% investors paid on average for fund investing overall last year, according to Morningstar’s most recent annual fee survey.

“As you’ll see with the most specialized product, there is typically a fee premium, and in the case of most commodity portfolios, this is no different,” Cavagnaro says. “An active approach to asset allocation comes with the responsibility to obtain exposures at reasonable costs and with an eye towards future return potential. It’s been hard to own some segments of the market for an extended period of time, but it’s also important to remember why and how it's important to remain diversified.”

Scroll through to see the 20 mutual funds with the worst 10-year returns through Aug. 28. Funds with less than $500 million in AUM and with investment minimums over $100,000 were excluded, as were leveraged and institutional funds. Assets and expense ratios, as well as YTD, one-, three-, five- and 10-year returns are listed for each. The data show each fund's primary share class. All data is from Morningstar Direct.

FP083120_20 copy.png

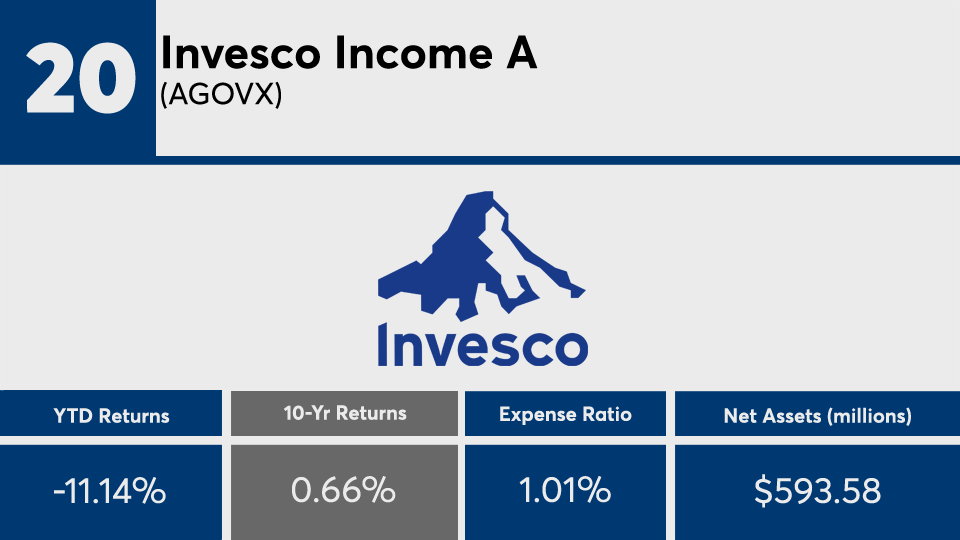
Invesco Income A (AGOVX)

1-Yr. Return: -9.57%
3-Yr. Annualized Return: -1.77%
5-Yr. Annualized Return: -0.5%
Front Load: 4.25%
FP083120_19 copy.png

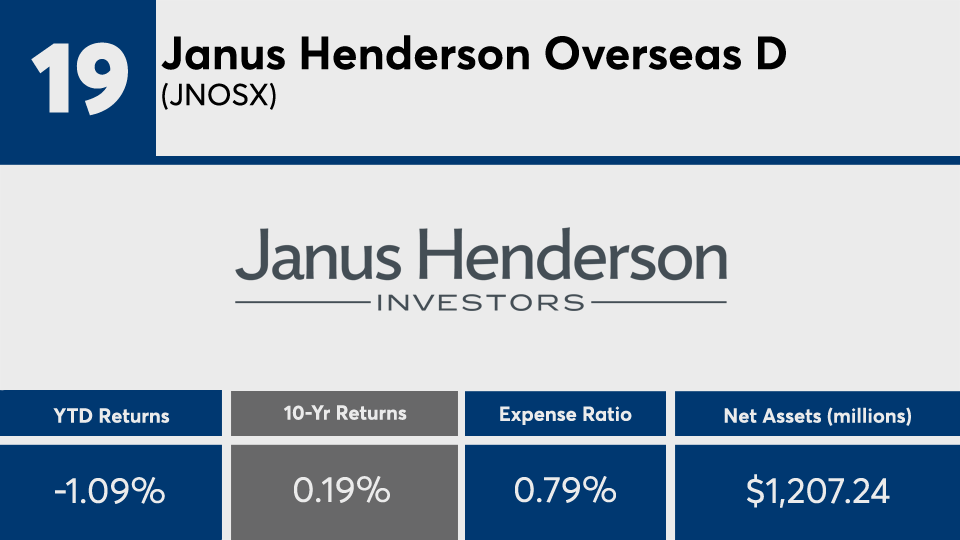
Janus Henderson Overseas D (JNOSX)

1-Yr. Return: 17.88%
3-Yr. Annualized Return: 4.17%
5-Yr. Annualized Return: 5.42%
FP083120_18 copy.png

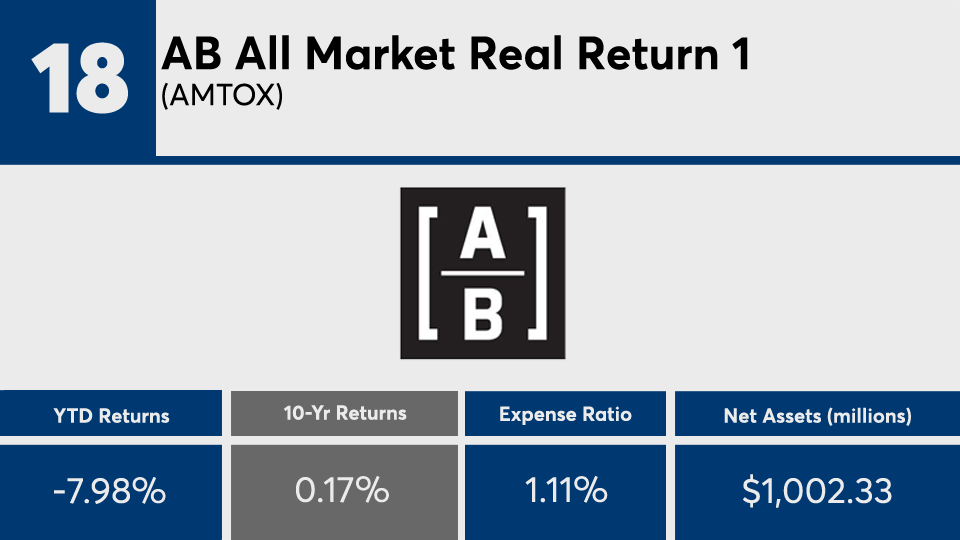
AB All Market Real Return 1 (AMTOX)

1-Yr. Return: 0.28%
3-Yr. Annualized Return: 0.57%
5-Yr. Annualized Return: 2.47%
FP083120_17 copy.png

VanEck International Investors Gold A (INIVX)

1-Yr. Return: 43.85%
3-Yr. Annualized Return: 20.42%
5-Yr. Annualized Return: 24.01%
Front Load: 5.75%
FP083120_16 copy.png

Vanguard Energy Admiral (VGELX)

1-Yr. Return: -22.2%
3-Yr. Annualized Return: -9.26%
5-Yr. Annualized Return: -3.4%
FP083120_15 copy.png

Invesco Oppenheimer Gold & Special Mineral A (OPGSX)

1-Yr. Return: 45.41%
3-Yr. Annualized Return: 21.82%
5-Yr. Annualized Return: 25.46%
Front Load: 5.50%
FP083120_14 copy.png

Invesco Opp SteelPath MLP Select 40 Y (MLPTX)

1-Yr. Return: -29.92%
3-Yr. Annualized Return: -13.63%
5-Yr. Annualized Return: -9.07%
FP083120_13 copy.png

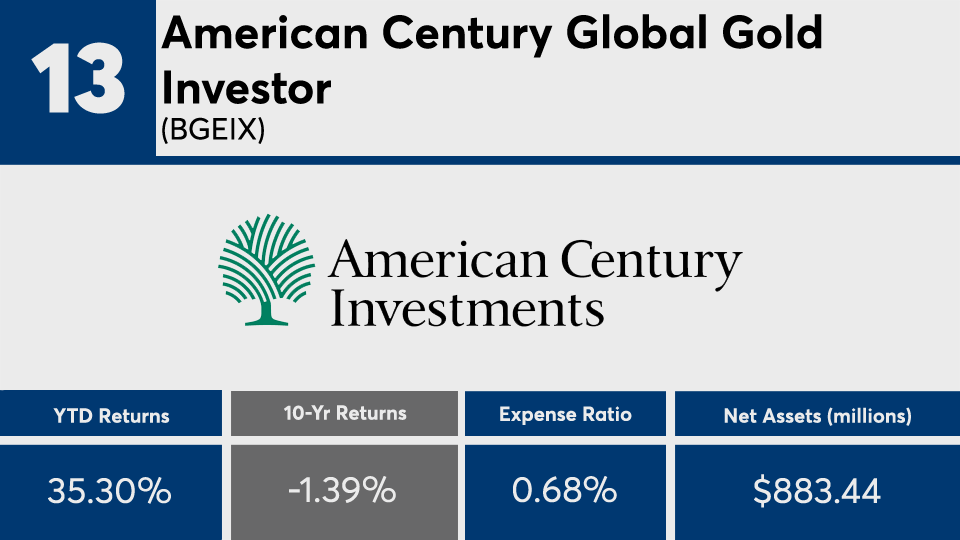
American Century Global Gold Investor (BGEIX)

1-Yr. Return: 31.25%
3-Yr. Annualized Return: 20.01%
5-Yr. Annualized Return: 24%
FP083120_12 copy.png

Sprott Gold Equity Investor (SGDLX)

1-Yr. Return: 34.16%
3-Yr. Annualized Return: 14.84%
5-Yr. Annualized Return: 18.17%
Redemption Load: 2%
FP083120_11 copy.png

Fidelity Select Gold (FSAGX)

1-Yr. Return: 36.13%
3-Yr. Annualized Return: 17.37%
5-Yr. Annualized Return: 21.18%
FP083120_10 copy.png

Vanguard Energy Index Admiral (VENAX)

1-Yr. Return: -31.25%
3-Yr. Annualized Return: -14.45%
5-Yr. Annualized Return: -8.75%
FP083120_9 copy.png

Franklin Gold and Precious Metals A (FKRCX)

1-Yr. Return: 46.28%
3-Yr. Annualized Return: 20.03%
5-Yr. Annualized Return: 20.78%
FP083120_8 copy.png

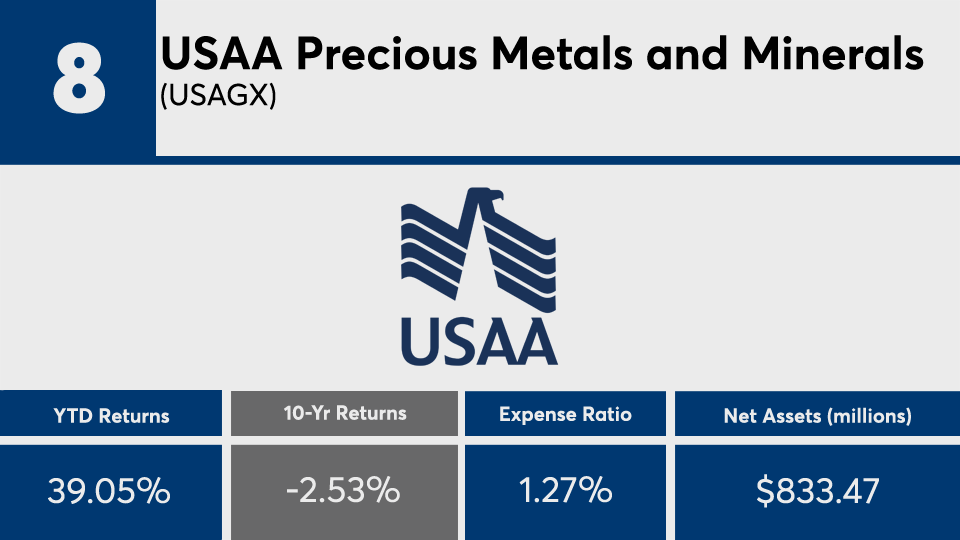
USAA Precious Metals and Minerals (USAGX)

1-Yr. Return: 38.22%
3-Yr. Annualized Return: 20.98%
5-Yr. Annualized Return: 22.15%
FP083120_7 copy.png

Fidelity Select Energy (FSENX)

1-Yr. Return: -30.84%
3-Yr. Annualized Return: -14.91%
5-Yr. Annualized Return: -9.33%
FP083120_6 copy.png

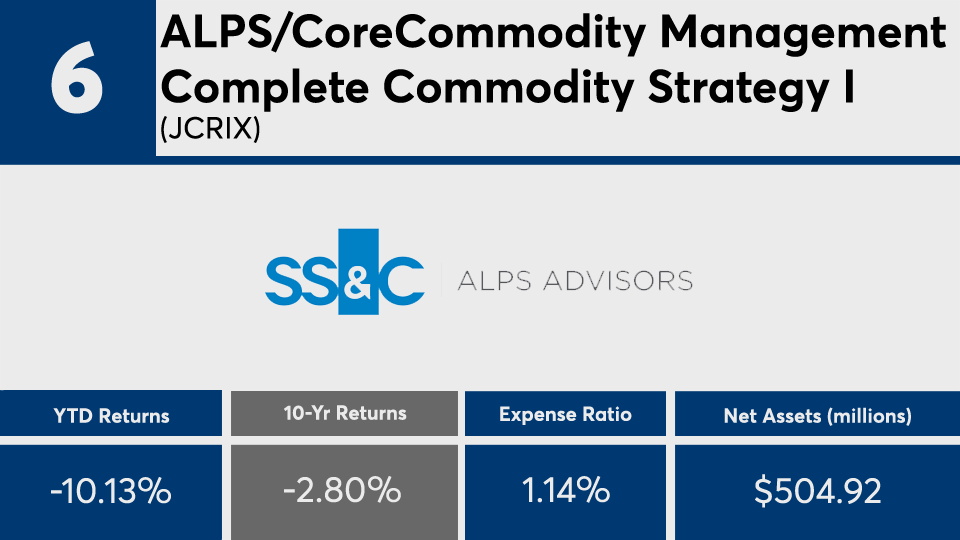
ALPS/CoreCommodity Management Complete Commodity Strategy I (JCRIX)

1-Yr. Return: 0.19%
3-Yr. Annualized Return: -1.72%
5-Yr. Annualized Return: -0.6%
Redemption Load: 2%
FP083120_5 copy.png

Invesco Opp SteelPath MLP Alpha Y (MLPOX)

1-Yr. Return: -30.82%
3-Yr. Annualized Return: -15.29%
5-Yr. Annualized Return: -12.09%
FP083120_4 copy.png

Invesco Opp SteelPath MLP Income A (MLPDX)

1-Yr. Return: -28.73%
3-Yr. Annualized Return: -12.47%
5-Yr. Annualized Return: -9.12%
Front Load: 5.50%
FP083120_3 copy.png

PGIM Jennison Natural Resources Z (PNRZX)

1-Yr. Return: 0.22%
3-Yr. Annualized Return: -4.09%
5-Yr. Annualized Return: -1.22%
FP083120_2 copy.png

Fidelity Series Commodity Strategy (FCSSX)

1-Yr. Return: -2.92%
3-Yr. Annualized Return: -3.02%
5-Yr. Annualized Return: -4.26%
FP083120_1 copy.png

Vanguard Global Capital Cycles Investor (VGPMX)

1-Yr. Return: 12.07%
3-Yr. Annualized Return: -5.47%
5-Yr. Annualized Return: 5.44%
MORE FROM FINANCIAL PLANNING