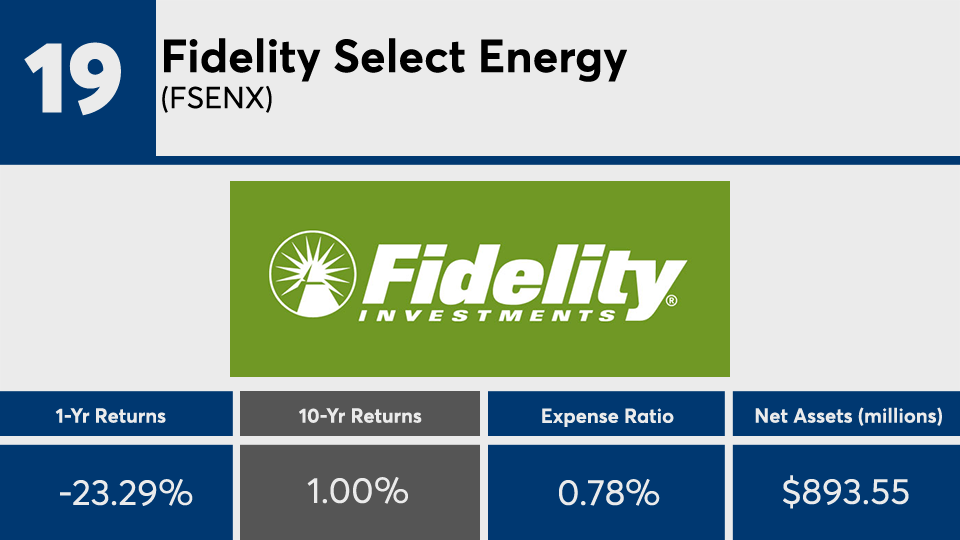
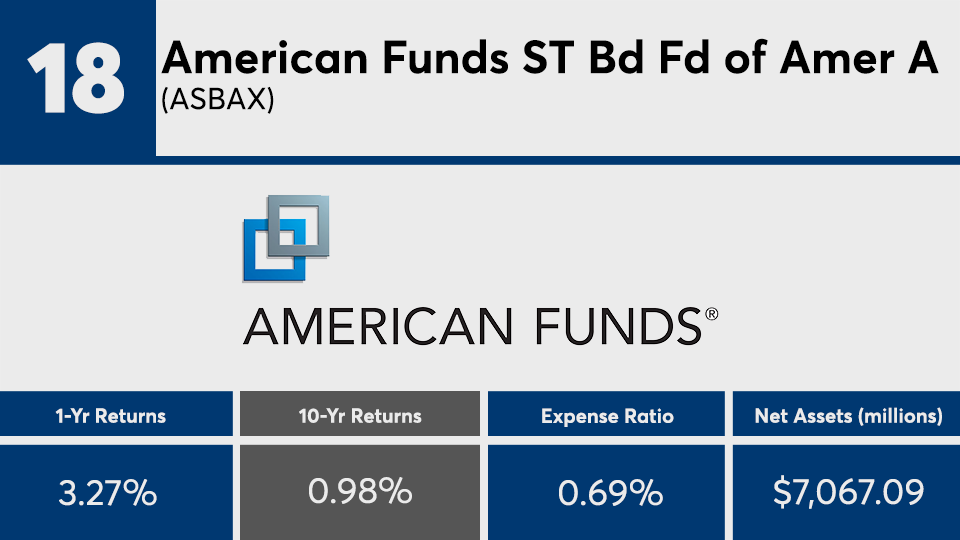
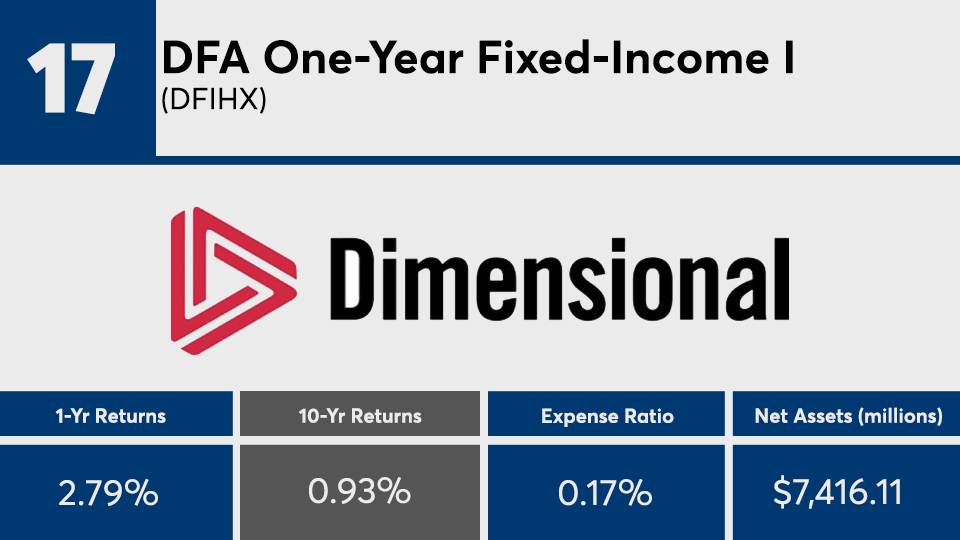
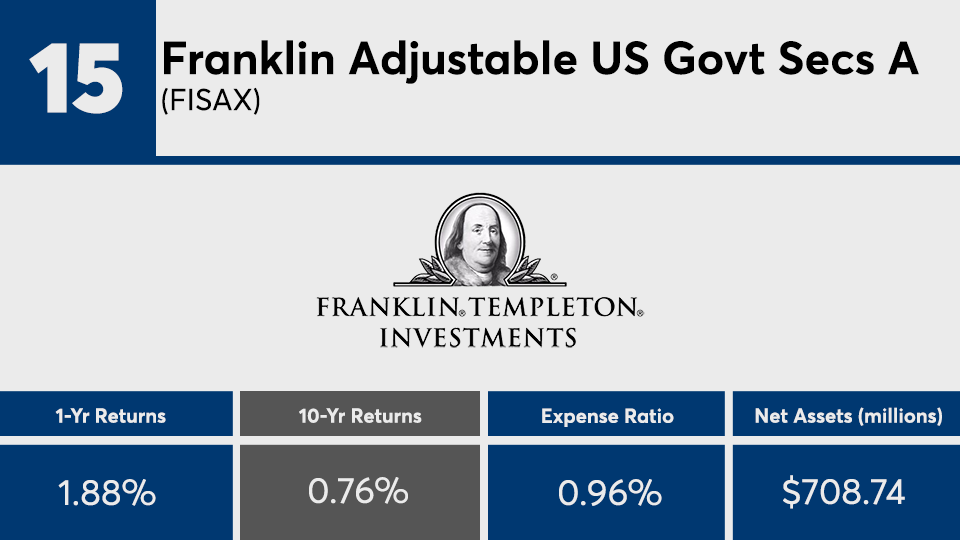
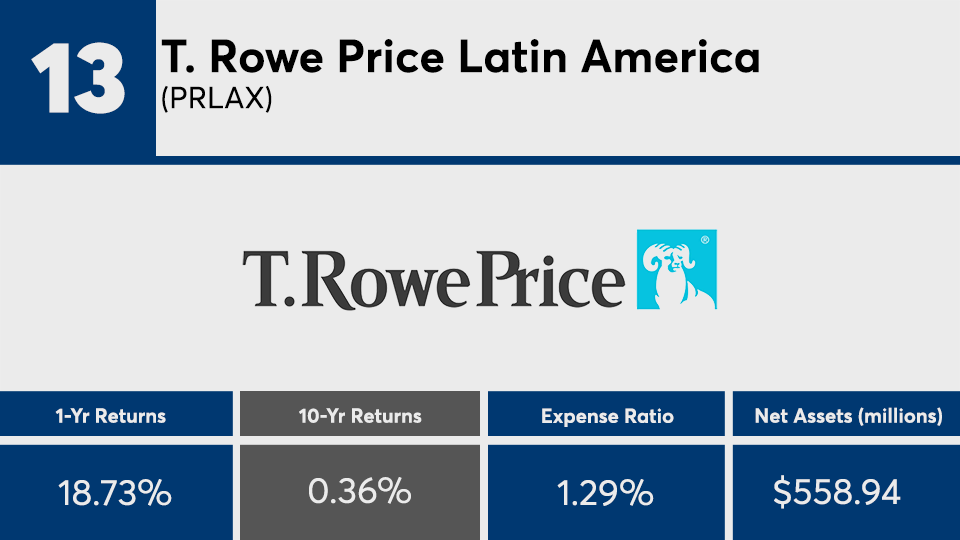
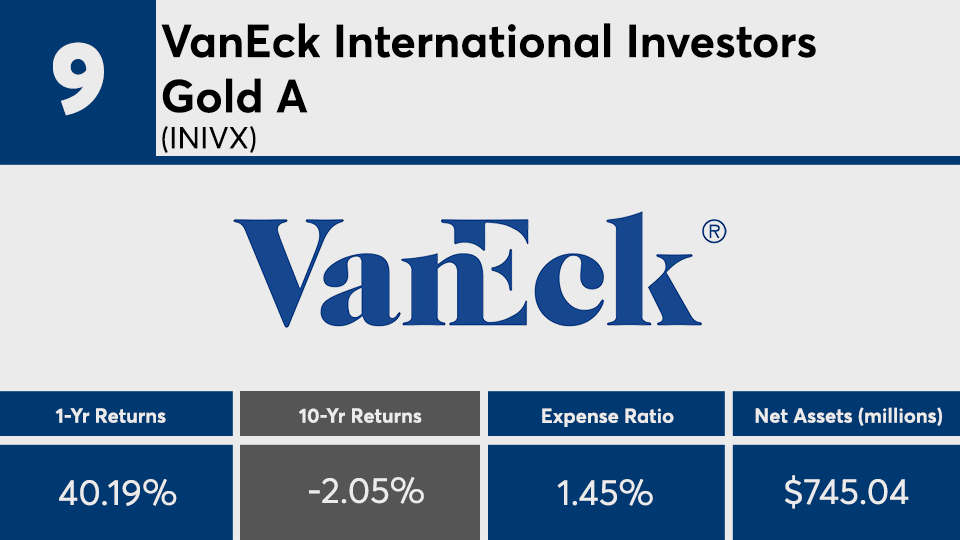
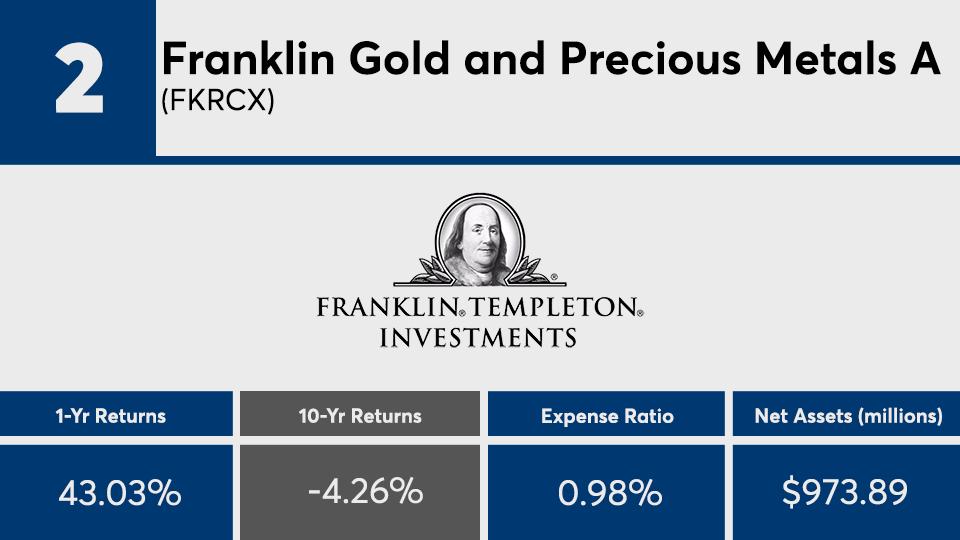
A quick look at one-year returns for the worst performing actively managed funds of the last decade might be confusing.
On average, active products with the worst performance over 10 years, and at least $500 million in assets under management, recorded a loss of 1.27%, according to Morningstar Direct. However, those funds had some of the largest gains over the past year. Greg McBride, senior financial analyst at Bankrate, says funds hyperfocused on poor-performing sectors are what landed them at the bottom of the 10-year barrel — and with gains as high as 43% over the past 12 months.
“Some of the worst-performing funds over the past decade have stellar returns over the past 12 months,” McBride notes, adding that it only, “illustrates the feast or famine nature of sector investing and begs the question about how poor the performance was in the preceding nine years.”
After popping the hood, it is clear why many of these funds fell out of favor during the steady market gains of the past decade. Their deviation from the broader market left more than half with losses at a time when the Dow posted a 10-year gain of 13.35%, as measured by SPDR Dow Jones Industrial Average ETF (DIA), and the S&P 500 with a 13.16% gain over the same period. “The worst returns over the past decade are a reflection of the sectors that lagged over that period of time — commodities and precious metals, energy, geographically narrow international markets and fixed income,” McBride says.
The price of investing in these poor performers was high. At 91 basis points, the average expense ratio among the worst-performing active products was 7 basis points higher than the top-performing active fund and 43 basis points higher than the 0.48% investors paid on average for fund investing, according to Morningstar’s most recent annual fee survey, which reviewed the asset-weighted average expense ratios of all U.S. open-end mutual funds and ETFs. With $191.5 billion in assets under management and a 0.62% net expense ratio, the industry’s largest active fund, the American Funds Growth Fund of America (AGTHX), posted an average 10-year return of 12.58% and one-year return of just 1.33%, data show.
“Trading tangible assets is costlier than trading financial assets,” McBride says, adding that the phenomenon “is reflected in the higher expense ratios of commodity and precious metals funds.”
Scroll through to see the 20 worst-performing actively managed funds (with at least $500 million in assets under management) ranked by 10-year annualized returns through Sept. 19. Funds with investment minimums over $100,000 were excluded, as were leveraged and institutional funds. Assets and expense ratios for each, as well as one-year daily returns, are also listed. The data shows each fund's primary share class. All data from Morningstar Direct.

