But there’s always a select few that outperform. The 20 funds listed here posted the top returns in this category over three years, with an average annualized return of 18.2%.
By comparison, small-cap funds over the last three years it posted a similar return of 12.57%, as measured by a large ETF benchmark. Despite the almost identical returns between large-cap and small-cap, there is one key difference: Many large-cap U.S. funds include companies with significant overseas revenue, offering much needed international exposure that may be lacking in some investors’ portfolios, notes Greg McBride, chief financial analyst at financial website Bankrate.
He cautions against buying one over the other, instead suggesting that a broader market approach is a better option.
“I’m not a fan of either/or investment allocation. Instead of trying to pick winners and find the needle in the haystack, I favor buying the whole haystack, which means companies of all sizes – large cap, mid cap and small cap,” McBride says.
Expense ratios for the 20 funds listed here averaged a relatively high 88 basis points. They range from a low of 15 basis points (an iShares ETF) to a high of just over 2% (a Morgan Stanley fund.)
Click through to see the top 20 large-cap funds over the past three years. We also include one-year returns, expense ratios and total assets. Only funds with at least $100 million are included. All data from Morningstar Direct.
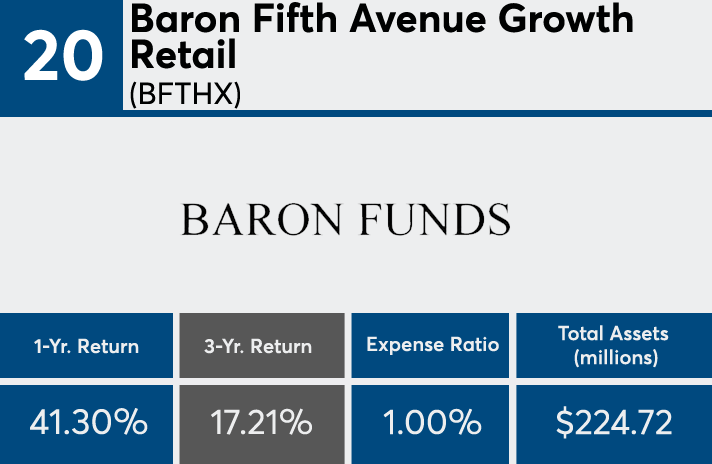
20. Baron Fifth Avenue Growth Retail (BFTHX)
3-Yr. Return: 17.21%
Expense Ratio: 1.00%
Net Assets (millions): $224.72

19. MassMutual Select Blue Chip Growth R5 (MBCSX)
3-Yr. Return: 17.23%
Expense Ratio: 0.75%
Net Assets (millions): $2,687.49
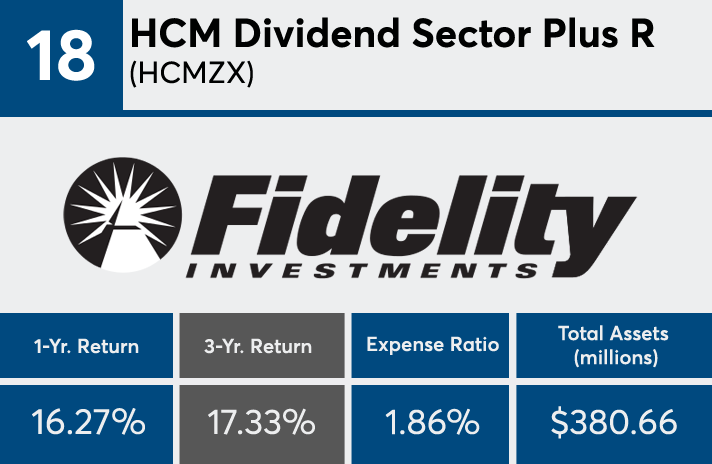
18. HCM Dividend Sector Plus R (HCMZX)
3-Yr. Return: 17.33%
Expense Ratio: 1.86%
Net Assets (millions): $380.66
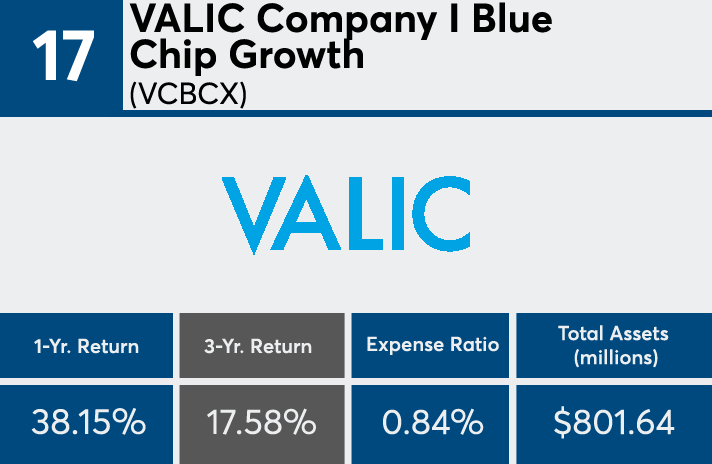
17. VALIC Company I Blue Chip Growth (VCBCX)
3-Yr. Return: 17.58%
Expense Ratio: 0.84%
Net Assets (millions): $801.64
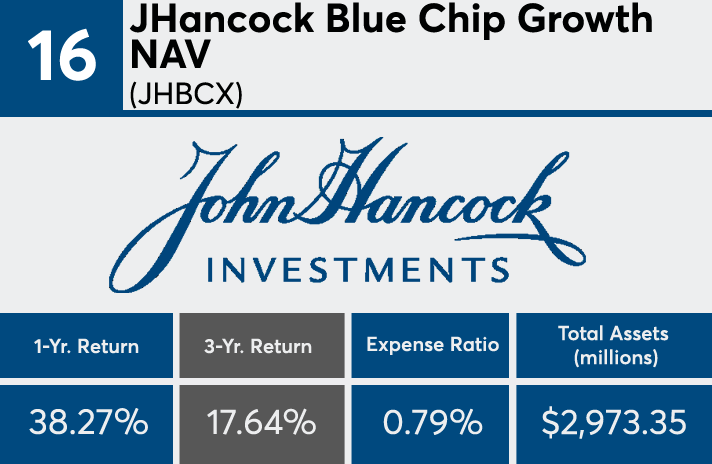
16. JHancock Blue Chip Growth NAV (JHBCX)
3-Yr. Return: 17.64%
Expense Ratio: 0.79%
Net Assets (millions): $2,973.35

15. Rydex NASDAQ-100 Inv (RYOCX)
3-Yr. Return: 17.71%
Expense Ratio: 1.29%
Net Assets (millions): $1,196.17

14. T. Rowe Price Blue Chip Growth (TRBCX)
3-Yr. Return: 17.75%
Expense Ratio: 0.72%
Net Assets (millions): $51,200.29
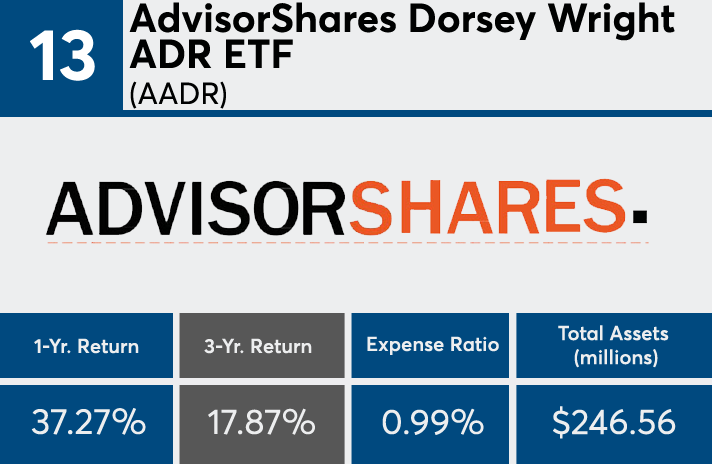
13. AdvisorShares Dorsey Wright ADR ETF (AADR)
3-Yr. Return: 17.87%
Expense Ratio: 0.99%
Net Assets (millions): $246.56
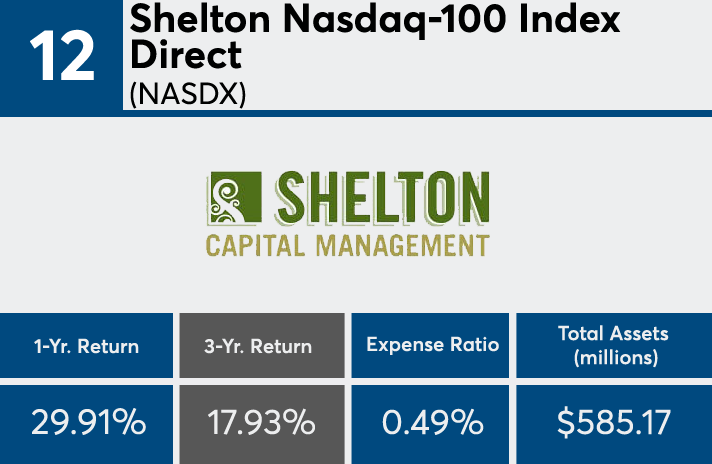
12. Shelton Nasdaq-100 Index Direct (NASDX)
3-Yr. Return: 17.932%
Expense Ratio: 0.49%
Net Assets (millions): $585.17

11. Homestead Growth (HNASX)
3-Yr. Return: 17.934%
Expense Ratio: 0.95%
Net Assets (millions): $202.23
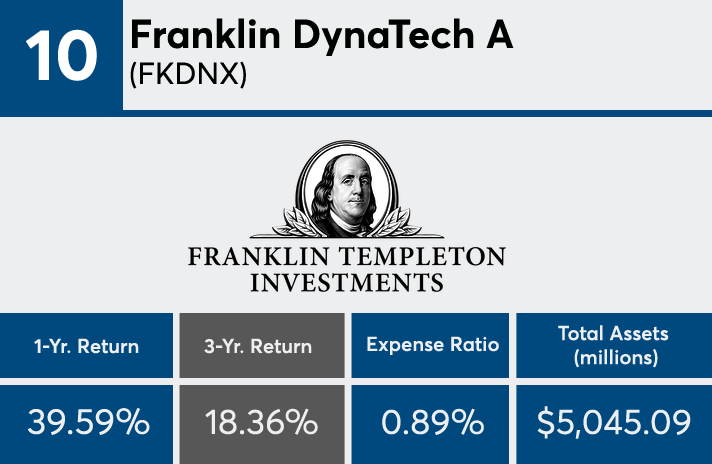
10. Franklin DynaTech A (FKDNX)
3-Yr. Return: 18.36%
Expense Ratio: 0.89%
Net Assets (millions): $5,045.09

9. Fidelity OTC (FOCPX)
3-Yr. Return: 18.40%
Expense Ratio: 0.81%
Net Assets (millions): $19,096.06

8. iShares Edge MSCI USA Momentum Fctr ETF (MTUM)
3-Yr. Return: 18.50%
Expense Ratio: 0.15%
Net Assets (millions): $8,125.97

7. USAA NASDAQ-100 Index (USNQX)
3-Yr. Return: 18.55%
Expense Ratio: 0.54%
Net Assets (millions): $1,857.41

6. Fidelity Growth Company (FDGRX)
3-Yr. Return: 18.56%
Expense Ratio: 0.85%
Net Assets (millions): $43,846.49

5. VALIC Company I NASDAQ-100 Index (VCNIX)
3-Yr. Return: 18.57%
Expense Ratio: 0.53%
Net Assets (millions): $483.54
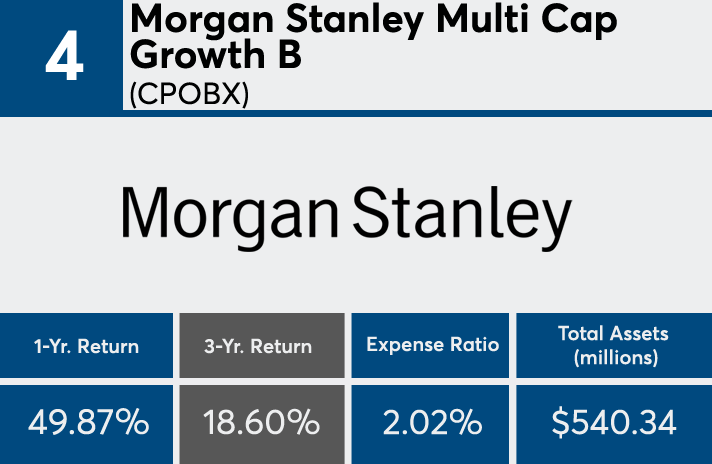
4. Morgan Stanley Multi Cap Growth B (CPOBX)
3-Yr. Return: 18.60%
Expense Ratio: 2.02%
Net Assets (millions): $450.34

3. PRIMECAP Odyssey Growth (POGRX)
3-Yr. Return: 18.75%
Expense Ratio: 0.67%
Net Assets (millions): $12,628.02
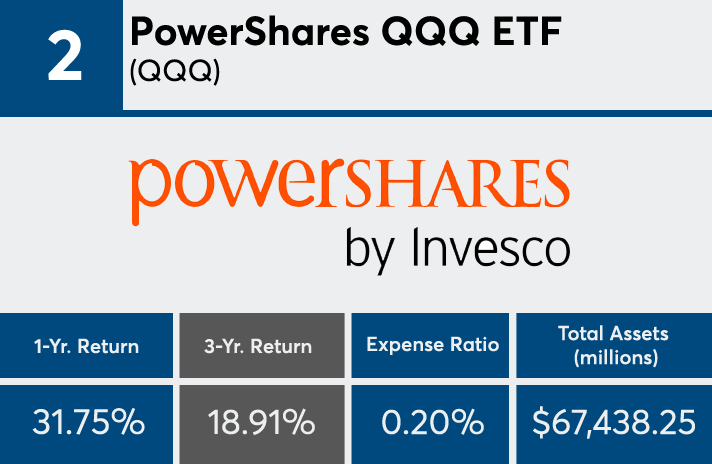
2. PowerShares QQQ ETF (QQQ)
3-Yr. Return: 18.91%
Expense Ratio: 0.20%
Net Assets (millions): $67,438.25

1. Transamerica Capital Growth A (IALAX)
3-Yr. Return: 19.79%
Expense Ratio: 1.23%
Net Assets (millions): $1,001.40
