We considered funds with at least $100 million in assets that posted a loss over the past 12 months and ranked them by their inflows over that time. The average inflow was $667 million; the average return was -9%.
While performance chasing gets a lot of attention, this list shows the opposite trend can quietly happen at the same time. That is, these investors are buying on the downside, possibly due to a disciplined dollar-cost averaging strategy, in hopes of an upturn. Indeed, 2017 numbers show that the pendulum does swing. Year-to-date performance for these funds, while still averaging a loss, was less than -1%. The median was almost 5%.
Moreover, the fact that more than half of these funds are in real estate, with the rest being in oil or gold, suggests tactical buying rather than a long-term strategic strategy.
Scroll through to see the biggest cash inflows from funds that have posted a loss for the past 12 months. All data from Morningstar.

20. Fidelity Select Natural Resources Port (FNARX)
1-Yr. Returns: -1.25%
Expense Ratio: 0.83%
Total Assets (millions): $847

19. iShares Core US REIT ETF (USRT)
1-Yr. Returns: -3.34%
Expense Ratio: 0.28%
Total Assets (millions): $150

18. Franklin Gold and Precious Metals (FKRCX)
1-Yr. Returns: -26.85%
Expense Ratio: 1.11%
Total Assets (millions): $1,084
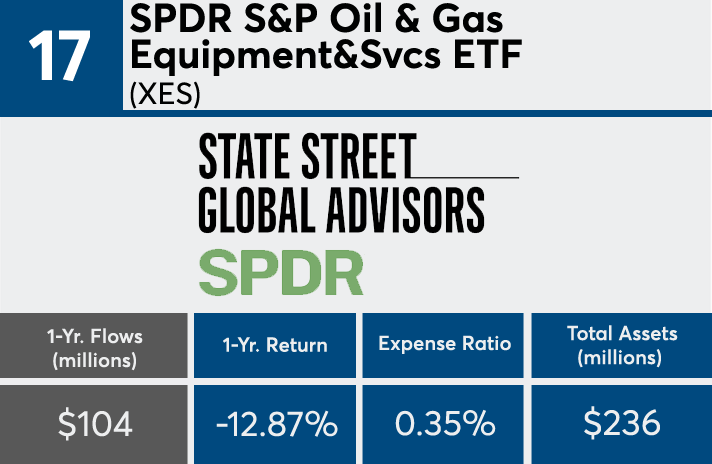
17. SPDR S&P Oil & Gas Equipment&Svcs ETF (XES)
1-Yr. Returns: -12.87%
Expense Ratio: 0.35%
Total Assets (millions): $236
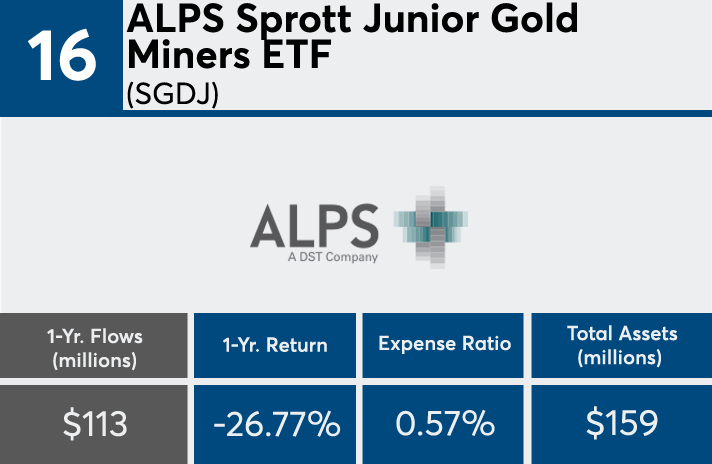
16. ALPS Sprott Junior Gold Miners ETF (SGDJ)
1-Yr. Returns: -26.77%
Expense Ratio: 0.57%
Total Assets (millions): $159

15. SPDR S&P North American Natural Res ETF (NANR)
1-Yr. Returns: -2.10%
Expense Ratio: 0.35%
Total Assets (millions): $950

14. iShares MSCI Global Gold Miners ETF (RING)
1-Yr. Returns: -26.81%
Expense Ratio: 0.39%
Total Assets (millions): $375

13. Fidelity MSCI Real Estate ETF (FREL)
1-Yr. Returns: -1.52%
Expense Ratio: 0.11%
Total Assets (millions): $387
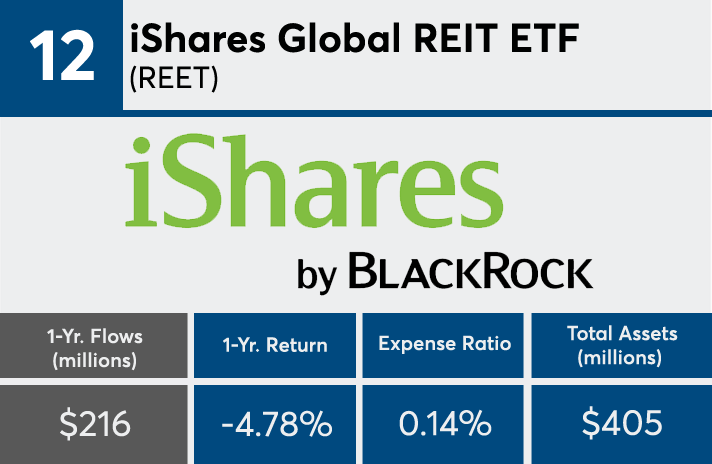
12. iShares Global REIT ETF (REET)
1-Yr. Returns: -4.78%
Expense Ratio: 0.14%
Total Assets (millions): $405
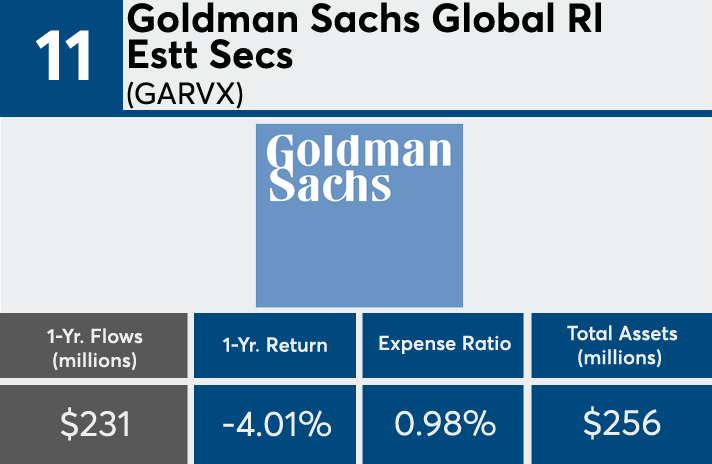
11. Goldman Sachs Global Rl Estt Secs (GARVX)
1-Yr. Returns: -4.01
Expense Ratio: 0.98%
Total Assets (millions): $256

10. SPDR Dow Jones Global Real Estate ETF (RWO)
1-Yr. Returns: -4.00%
Expense Ratio: 0.50%
Total Assets (millions): $2,669
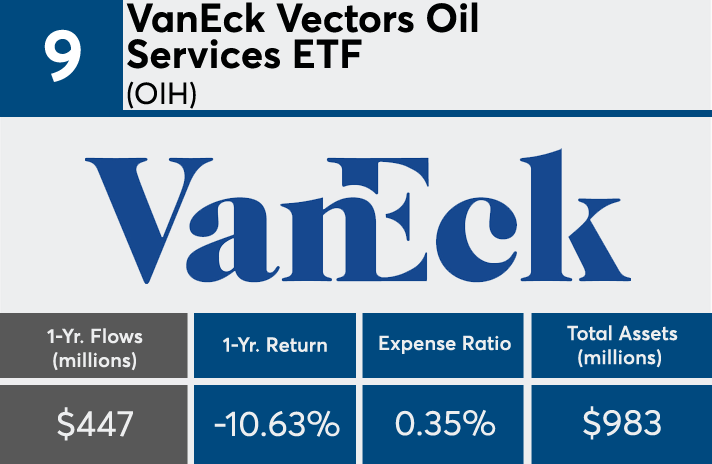
9. VanEck Vectors Oil Services ETF (OIH)
1-Yr. Returns: -10.63%
Expense Ratio: 0.35%
Total Assets (millions): $983
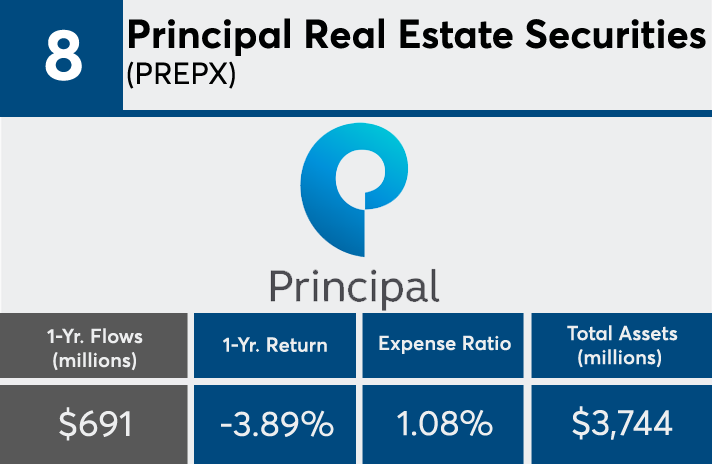
8. Principal Real Estate Securities (PREPX)
1-Yr. Returns: -3.89%
Expense Ratio: 1.08%
Total Assets (millions): $3,744
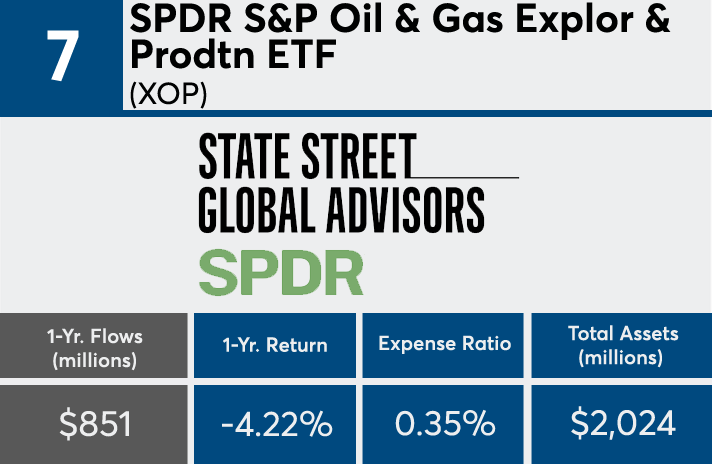
7. SPDR S&P Oil & Gas Explor & Prodtn ETF (XOP)
1-Yr. Returns: -4.22%
Expense Ratio: 0.35%
Total Assets (millions): $2,024

6. Schwab US REIT ETF (SCHH)
1-Yr. Returns: -5.86%
Expense Ratio: 0.07%
Total Assets (millions): $3,520

5. iShares Developed Real Estate (BKRDX)
1-Yr. Returns: -2.65%
Expense Ratio: 0.19%
Total Assets (millions): $1,310
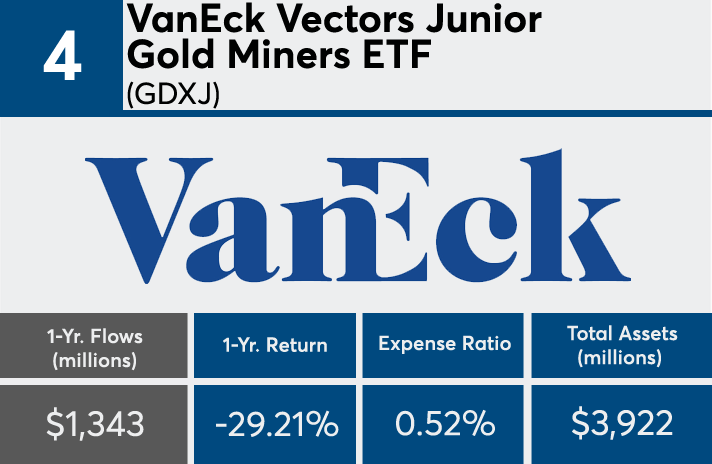
4. VanEck Vectors Junior Gold Miners ETF (GDXJ)
1-Yr. Returns: -29.21%
Expense Ratio: 0.52%
Total Assets (millions): $3,922
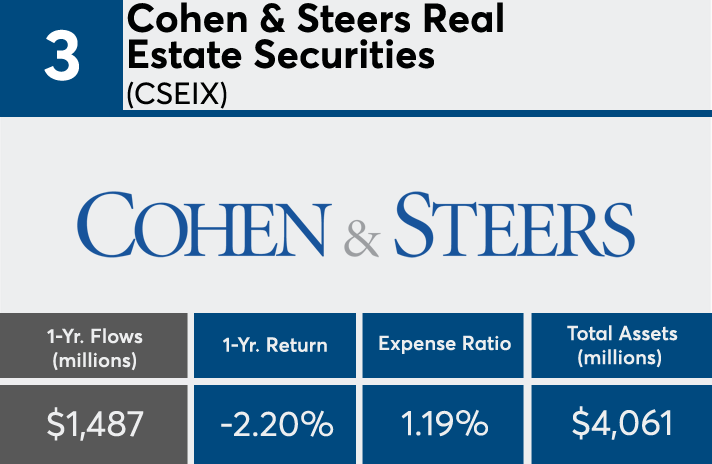
3. Cohen & Steers Real Estate Securities (CSEIX)
1-Yr. Returns: -2.20%
Expense Ratio: 1.19%
Total Assets (millions): $4,061

2. Vanguard REIT Index Investor (VGSIX)
1-Yr. Returns: -4.82%
Expense Ratio: 0.26%
Total Assets (millions): $64,623

1. Real Estate Select Sector SPDR (XLRE)
1-Yr. Returns: -2.20%
Expense Ratio: 0.07%
Total Assets (millions): $2,434
