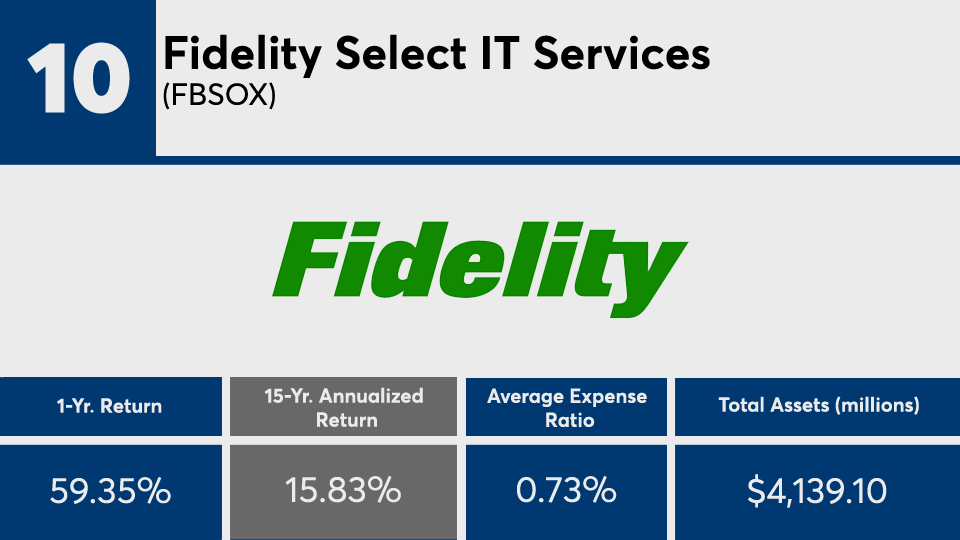
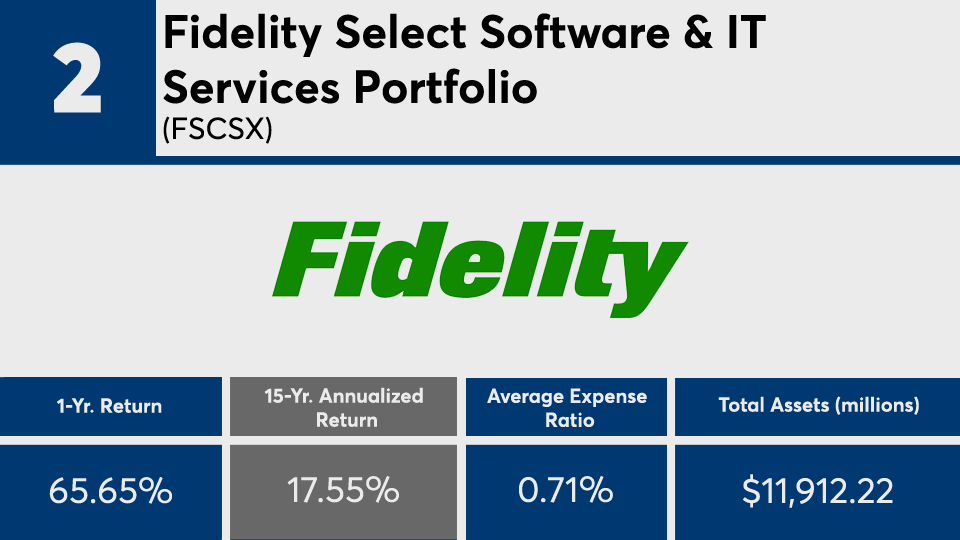
High fees aside, the top-performing actively managed funds have steadily produced market-beating returns.
The 20 active funds with the biggest 15-year gains, and at least $100 million in assets under management, notched an average return of nearly twice the broader industry, Morningstar Direct data show. Over the last year, a portfolio consisting of the same funds managed a 101.8% gain.

After an analysis of the largely technology sector mutual funds in the lineup, many with fees in the triple digits, 1879 Advisors Vice Chairman Jim Bruderman says it’s rankings like these that begs an advisor to take a deeper look.
“You want to show clients funds and managers that have done well with a consistent track record, but you also have to do your homework,” Bruderman says, adding that “half of the managers on the list have been replaced in the last five years. That’s meaningful, because if you're not buying the managers’ track records, then what record are you buying?”
Since 2006, index trackers such as the SPDR S&P 500 ETF Trust (
In bonds, the iShares Core U.S. Aggregate Bond ETF (
Across the board, fees among the top-performers were high. The funds in this ranking had net expense ratios well over 200 basis points. With an average fee of roughly 1.18%, the funds here were twice the 0.45% investors paid for fund investing in 2019, according to
“I don't think there's a whole lot a fund advisor is doing, unless they’re an alternative fund, that justifies these high fees,” Bruderman says. “Clearly you have to look at the risk-adjusted return, but what else is worth looking at here is whether or not the manager is running hot and cold. Is the manager consistently in the top quartile or do they flip-flop? If you’re looking at any one manager, you want to see them stay consistent.”
Read more:
Scroll through to see the 20 actively managed funds, with more than $100 million in AUM, and the biggest 15-year returns through March 24. Assets and average expense ratios, as well as year-to-date, one-, three-, five and 10-year returns also listed for each. As are YTD-, one-, three-, five-, 10- and 15-year net share class flows through March 1. The data show each fund's primary share class. All data is from Morningstar Direct.


