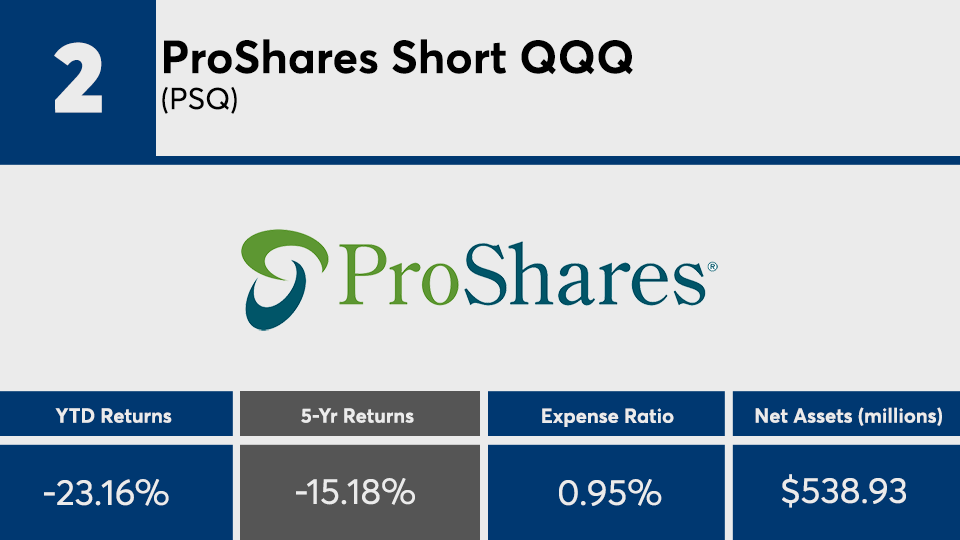
Following a year of steady gains from the major indexes, it should come as no surprise that high-priced funds that shorted the market were among the worst-performing.
Carrying an average year-to-date loss of more than 8%, the 20 mutual funds and exchange-traded products with the worst returns of 2019 severely underperformed the Dow’s 20.94%, as measured by the SPDR Dow Jones Industrial Average ETF (DIA); the S&P 500’s 25.10% gain, as measured by SPDR S&P 500 ETF (SPY); and the Bloomberg Barclays U.S. Aggregate’s 7.52% gain, as measured by the iShares Core US Aggregate Bond ETF (AGG), over the same period, according to Morningstar Direct.
Those that shorted the market “had steep losses,” while those that were market neutral “had modest gains — both due to rising asset prices,” Greg McBride, senior financial analyst at Bankrate, says.
When looking at a longer-term horizon, the worst performers did slightly better. With an average 5-year loss of more than 6%, these funds underperformed the Dow’s 12.02% gain, the S&P 500’s 10.77% gain and AGG’s 2.98% gain over the same period, data show.
“Short-term bond funds have generated low, but positive, returns in a year when low interest rates went even lower,” McBride explains. “But this is why you hold these funds, as the returns would have been similar even if the stock market had been down 23% instead of up 23%, year-to-date.”
Fees attached to the worst-performers were, expectedly, higher than their
The industry’s largest fund, the $845 billion Vanguard Total Stock Market Fund (VTSAX), carries a 0.04% expense ratio and has returned 24.67% so far this year.
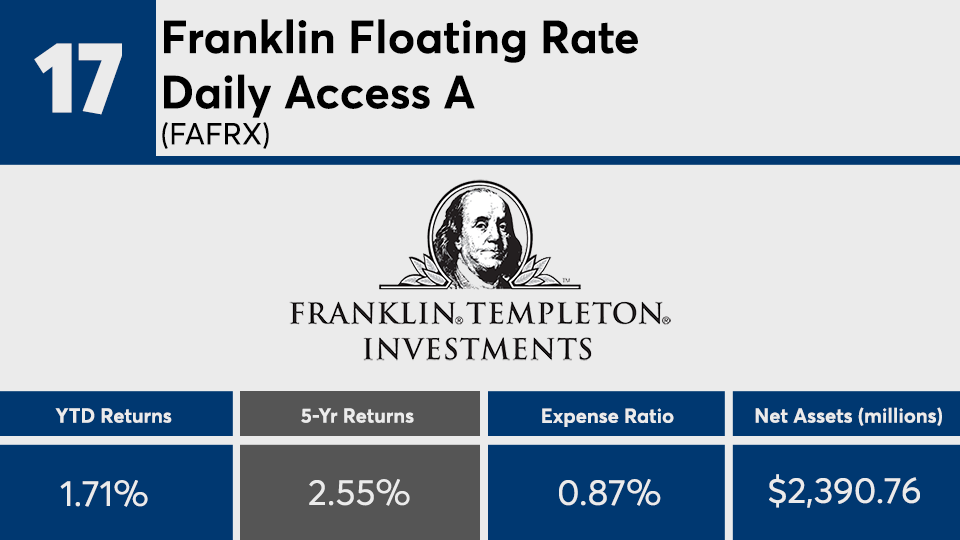
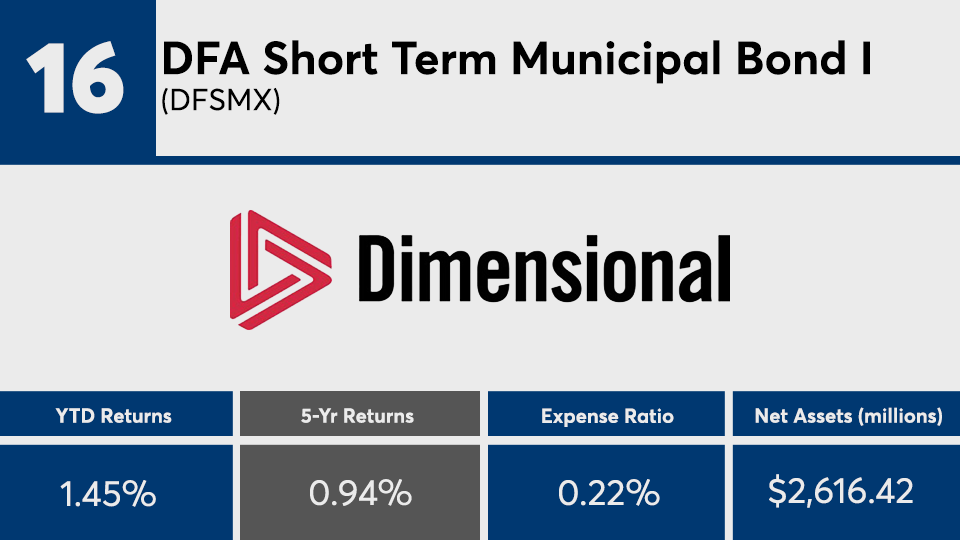
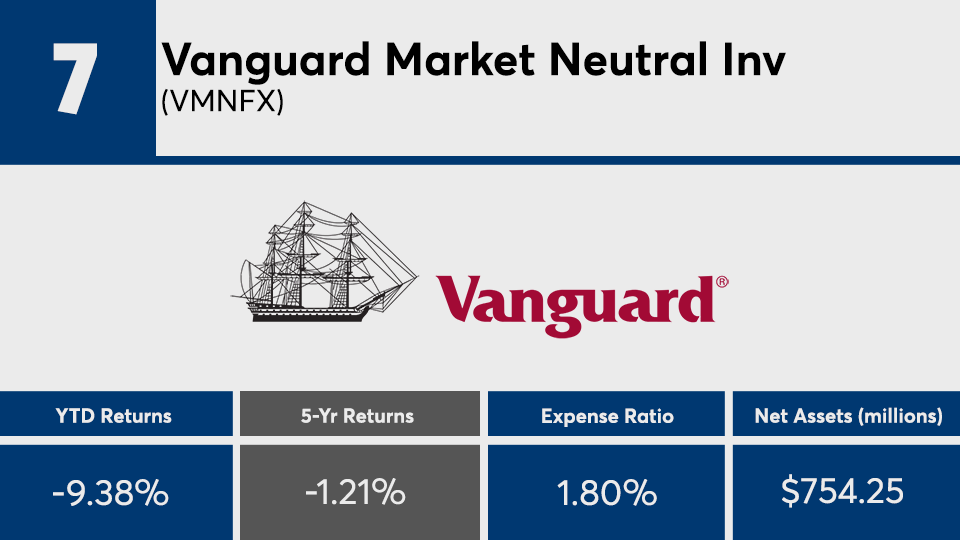
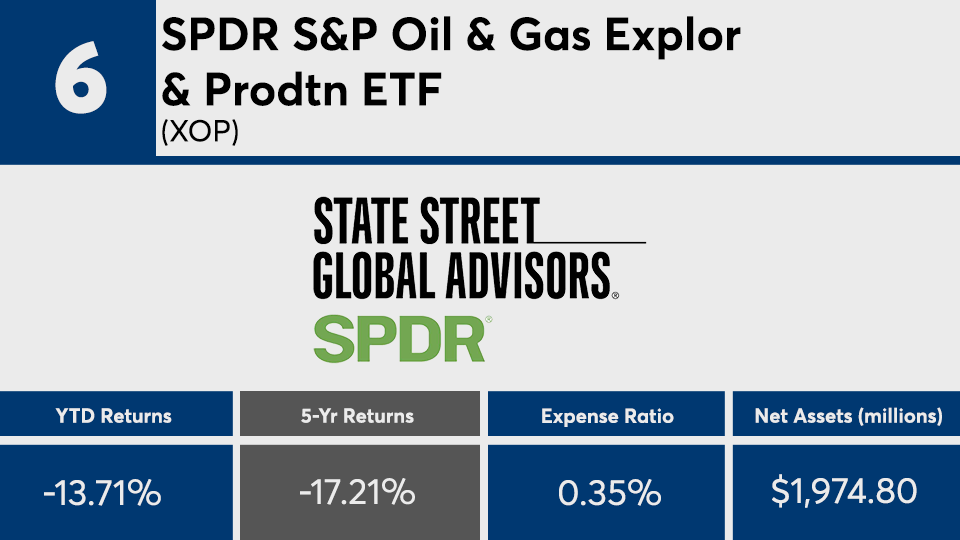
Scroll through to see the 20 worst-performing mutual funds and ETPs (with at least $500 million in assets under management) ranked by year-to-date returns through Nov. 7. Funds with investment minimums over $100,000 were excluded, as were leveraged and institutional funds. Assets and expense ratios for each, as well as year-to-date returns, are also listed. The data shows each fund's primary share class. All data from Morningstar Direct.


