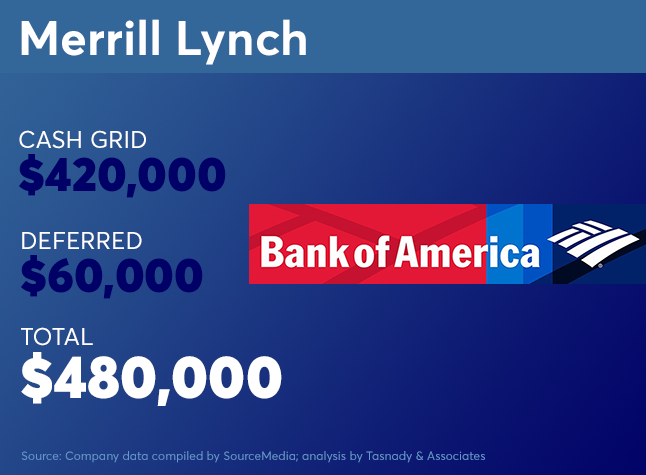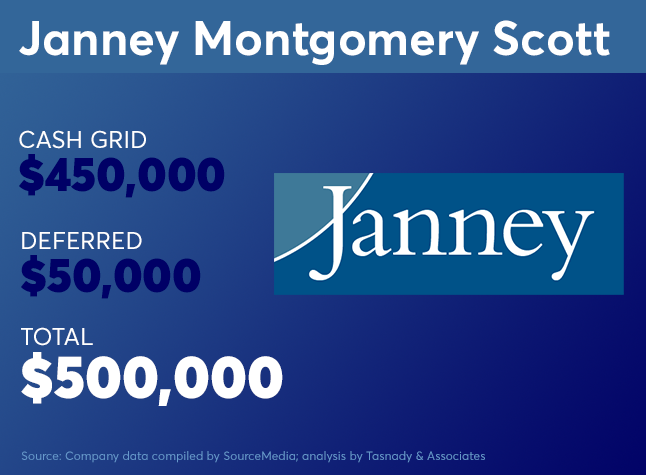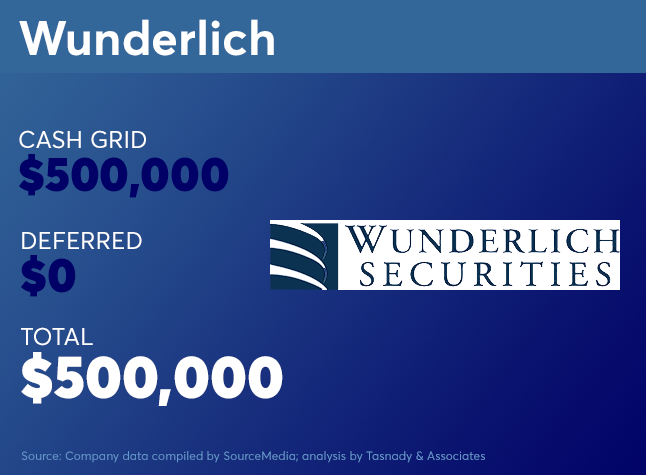
Our annual analysis of adviser pay at the wirehouse and regional broker-dealers helps elite advisers make that determination. Scroll through to see how comp plans stack up now.
To read last year's analysis,
Data was collected by SourceMedia and analysis conducted by
A number of special policies are not included here since they do not affect 100% of the population evenly and therefore are more haphazard to compare. Individual results can vary dramatically, based on the mix of business and policies at each firm. For example, pay can rise from special bonuses and fall from penalties such as discount sharing, small client limits and ticket charges
Assumptions for basic pay (prior to special policies/contingent bonuses):
· 25% in individual stocks; 25% in individual bonds, 25% in mutual funds; 25% in fee-based (wrap accounts, managed accounts, etc.)
· Year-end basic bonuses are shown in Deferred totals.
· Length of service is assumed to be 10 years.
· Assumes no bonuses from growth, nor asset-based bonuses, or other behavior-based awards.
Also excludes voluntary deferral matches, 401(k) matches or profit sharing contributions unless otherwise noted.
Does not include: T&E expense allowance, discount sharing or ticket charge expense assumptions, small household or small ticket policy assumptions, or value of any options awards.


