It’s not all bad news for the funds with the biggest outflows of 2019.
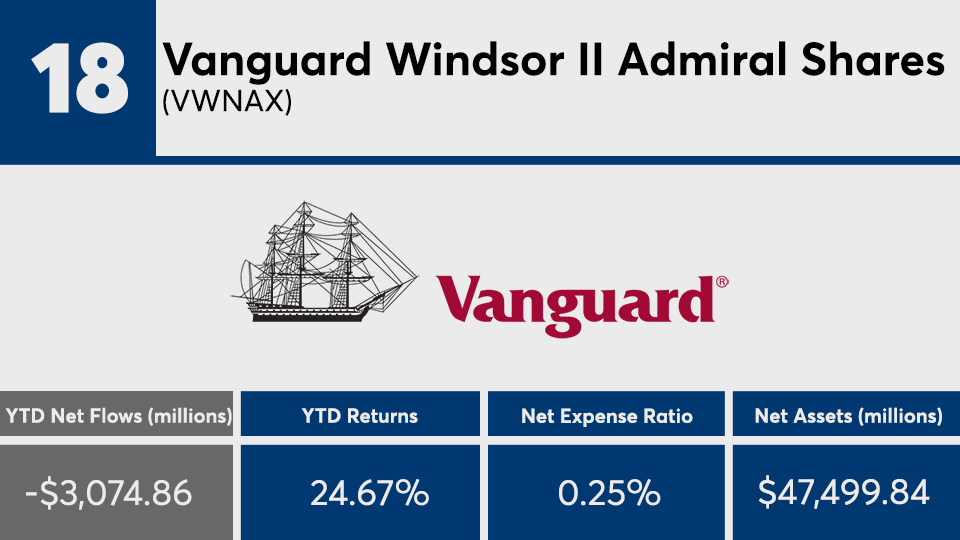
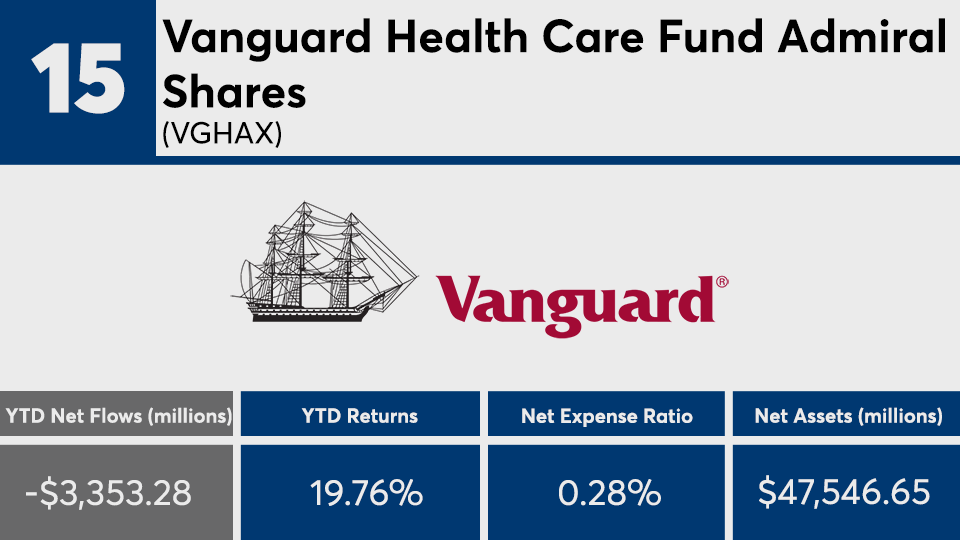
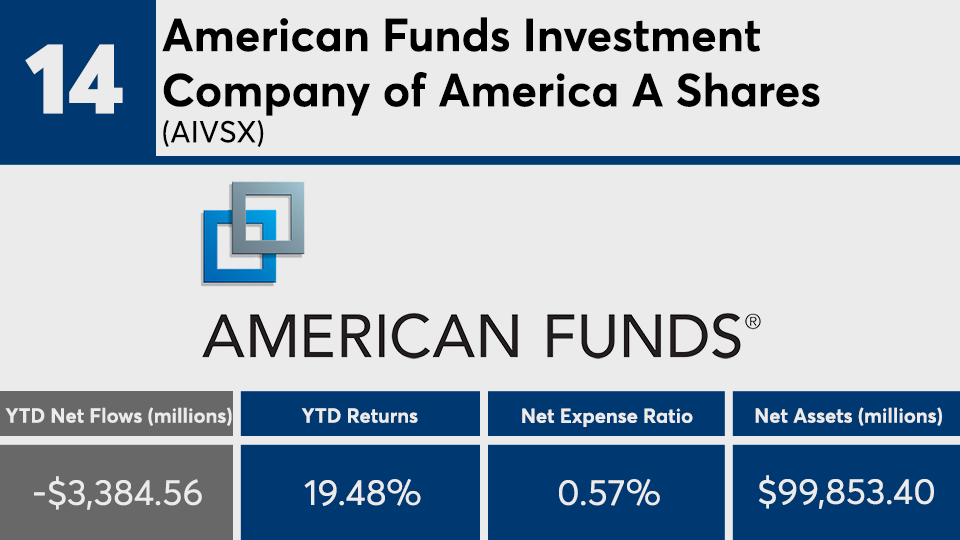
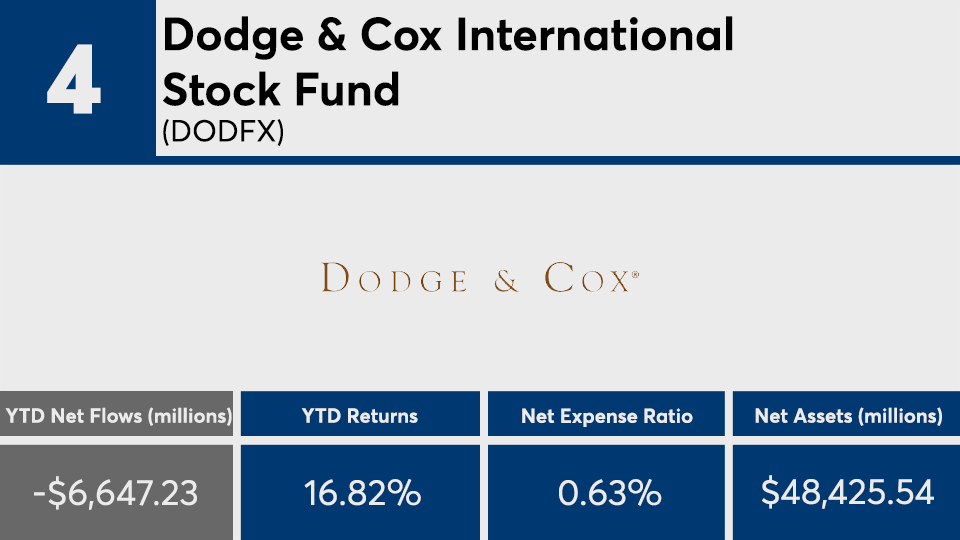
The 20 mutual funds and ETFs that recorded the largest year-to-date investor departures incurred a combined $88.8 billion in moves to either other share classes or through their fingers, Morningstar Direct data show. Those funds — all of which posted gains — were more heavily focused on the year’s most underperforms, says Greg McBride, a senior analyst at Bankrate.
“The largest outflows year-to-date have come from funds in lagging sectors — like energy or international stocks — or from those that are just bigger funds to begin with,” McBride says.
With an average gain of 0.16% as of Dec. 5, energy funds were the year's fourth worst-performing category behind bear market funds, which posted a 26.87% loss; U.S. commodity funds, with a 5.67% loss; and India equity funds, which had a 0.1% gain. Diversified emerging markets posted a 12.81% gain, foreign large value recorded a 14.28% gain and foreign large blend funds a 17.89% advance.
Despite underperforming the broader markets, these funds had an average YTD return of 19.21%, data show. That is just shy of the Dow’s 22.17% gain, as measured by the SPDR Dow Jones Industrial Average ETF (DIA), and the S&P 500’s 26.57% gain, as measured by the SPDR S&P 500 ETF (SPY), over the same period. The Barclays Capital U.S. Aggregate Bond Index, as measured by the iShares Core US Aggregate Bond ETF (AGG), reported a YTD gain of 8.44%.
When considering performance figures, Morningstar analyst Kevin McDevitt says many of these funds were simply victims of portfolio concentration. With many categories once a popular place for clients to move their cash, McDevitt says target-date funds and managed accounts have shifted their holdings to account for changing investor sentiment, leaving many well-known names at the top of the outflows list.
-
Those that shorted the market suffered “steep losses,” while market-neutral products posted “modest gains.”
November 13 -
“Not every muni is trying to achieve the same thing,” an expert says.
October 16 -
With an average gain of nearly 40%, the following mutual funds and ETFs are narrowly invested in the most attractive segments of the market.
November 6
“As target-date funds and managed portfolios get more popular, they’re doing more of the incremental buying and selling,” McDevitt says. “In the fourth quarter last year — when we had a nasty correction — you had positive flows for U.S. equity and international funds. What does that tell you? I suspect it's target-date funds buying to stay at their target weightings.”
The mix of both active and passive products carried a net expense ratio that met the industry average. At 0.48%, these funds were right on target with the 48 basis points investors were charged, on average, for fund investing last year, according to Morningstar’s most recent annual fee survey, which reviewed the asset-weighted average expense ratios of all U.S. open-end mutual funds and ETFs. The industry’s largest fund, the $845.5 billion Vanguard Total Stock Market Index Fund Admiral Shares (VTSAX) —
“People need to be careful making assumptions of what’s driving flows,” McDevitt warns, adding that a pure ranking of funds by inflows or outflows is “not a good gauge of investor sentiment. I would just be careful trying to read into that.”
Scroll through to see the 20 mutual funds and ETFs with the largest outflows as of Dec. 1. Funds with less than $500 million in AUM and investment minimums over $100,000 were excluded, as were leveraged and institutional funds. Assets and expense ratios for each, as well as three-year net flows and year-to-date returns, are also listed. The data shows each fund's primary share class. All data from Morningstar Direct.


